Just published a post, sent a newsletter or launched a campaign? Real-time analytics quickly tell you if people are arriving to your website, where they are coming from or what caused a sudden spike (not just show you a live visitor count).
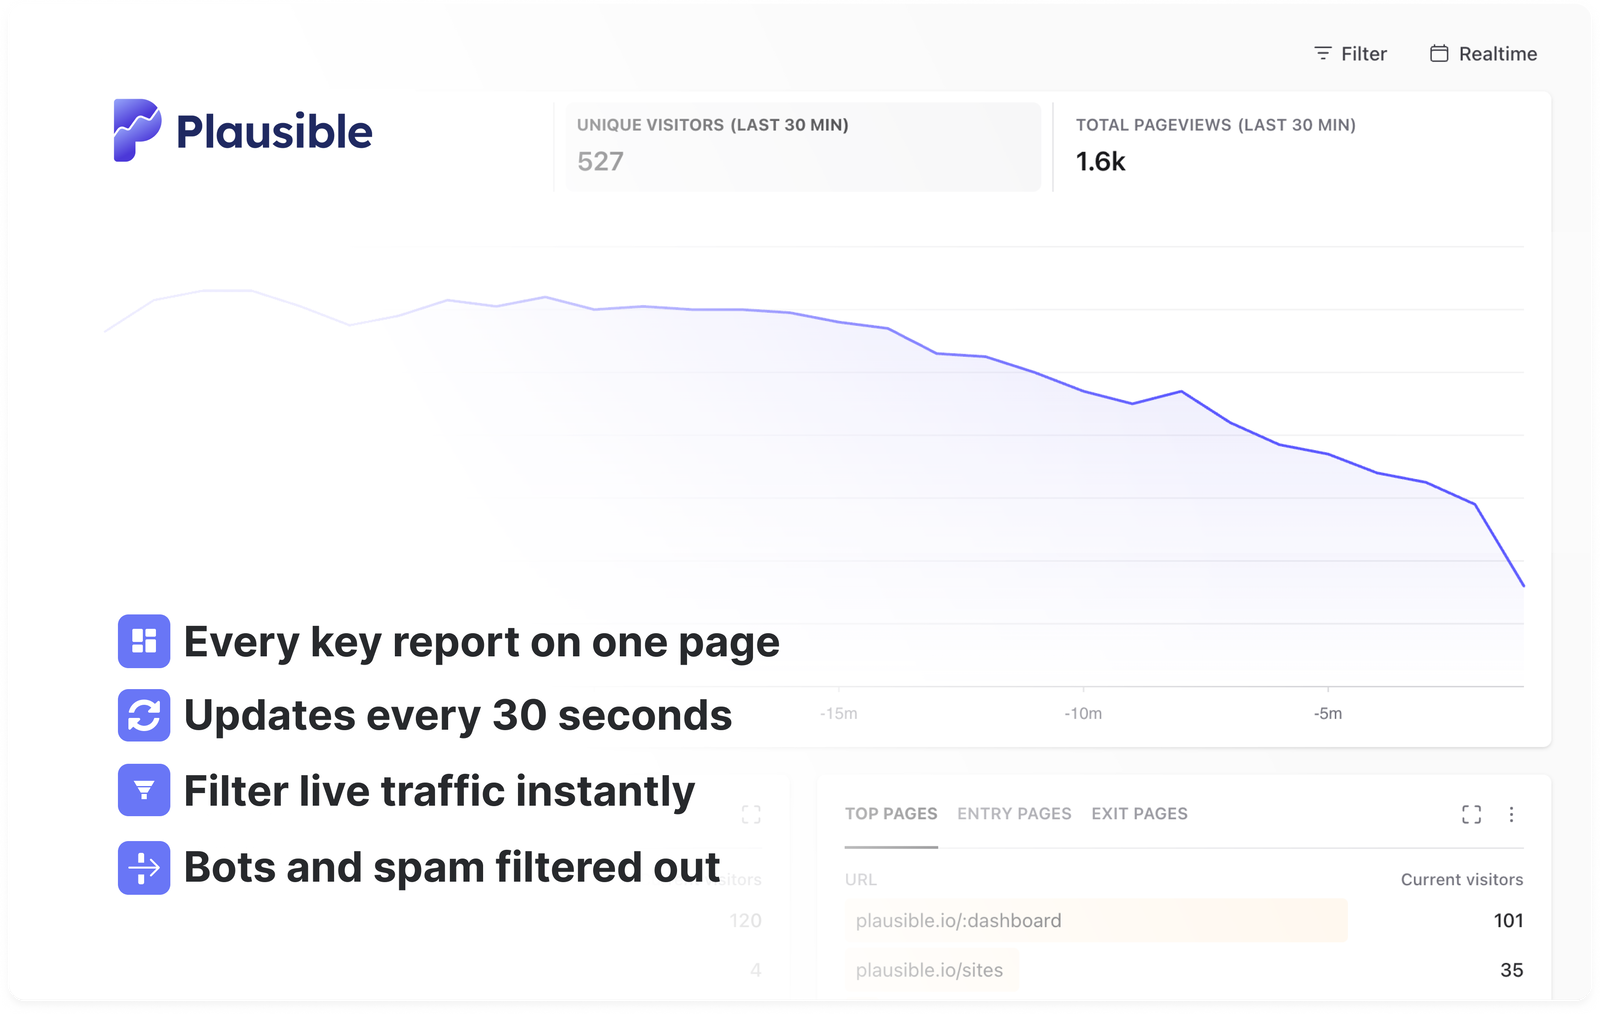
Plausible gives you the count and the context in the same simple, one-page dashboard: sources, pages, locations, devices, goals and conversions. Choose Realtime or press R, and the dashboard updates every 30 seconds without a refresh.
"My 100% favorite GA4 alternative so far is Plausible. Not free and not a ton of bells and whistles, but SOOOO easy to use (for clients too) and the data is near real-time. A good solution for ~70% of websites struggling with GA4."
- What is real-time web analytics?
- When is real-time analytics useful?
- Why Plausible’s real-time dashboard is different
- How to use real-time analytics in Plausible
- Plausible vs Google Analytics real-time reports
- Frequently asked questions
What is real-time web analytics?
Real-time web analytics is the collection and reporting of website activity within seconds or minutes of it happening. Instead of waiting for a daily report, you can see live visitors, pageviews, traffic sources, popular pages and conversions while people are using your site.
A useful real-time dashboard gives you an immediate answer to three core questions:
- How many people are on my site right now?
- Where are they coming from?
- What are they viewing or doing?
Real-time numbers are most useful for understanding what is happening now. Use a longer date range when you need to judge trends, compare periods or make decisions based on a representative sample.
When is real-time analytics useful?
Launching a blog post or product page
Watch visits arrive as soon as you publish. You can see which websites, communities or social posts are sending people your way and whether visitors are reaching the page you launched.
Monitoring a campaign
Follow a launch, promotion or paid campaign as it runs. Filter the dashboard by a UTM campaign, source or landing page to isolate that traffic and check the goals and conversions attributed to it.
Checking newsletter, social or ad traffic
After you send an email or publish a social post, use the Top Sources and Top Pages reports to confirm that clicks are arriving where expected. UTM parameters let you separate individual links and campaigns.
Watching a traffic spike
When current visitors suddenly rise, real-time reports help you investigate the traffic spike. Filter by a source or page to find the link, search result, community or piece of content behind it.
During a high-volume or viral moment, website journey analytics can show the paths visitors are taking from the page or event behind the spike.
Verifying that tracking is working
Open your website, visit a page and check the real-time view. Seeing the pageview arrive is a quick way to confirm that your analytics is receiving events. If it does not appear, follow this analytics installation checklist to check the setup, browser extensions and excluded traffic.
Spotting unexpected referrers or pages
A live view can surface a page that has suddenly become popular or a referrer you did not know had linked to you. That gives you a chance to join the conversation, fix an outdated page or make the most of unexpected attention while it is still happening.
Why Plausible’s real-time dashboard is different
One page instead of a collection of reports
The real-time view uses the same simple dashboard as the rest of Plausible. Visitors, sources, pages, locations, devices, goals and conversions stay together on one page, so there is less context switching at the moment speed matters most.
Privacy-friendly by design
Plausible does not use cookies, collect personal data or build profiles of individual visitors. Real-time reporting follows the same privacy-friendly data practices as every other Plausible report. You see useful aggregate activity without watching named individuals move through your site.
Built-in bot filtering
Live traffic is only helpful when it reflects people rather than crawlers and spam. Plausible automatically filters known bots, referrer spam, data-center traffic and suspicious traffic patterns. Learn more about our multi-layered bot filtering.
Fast, automatically updating dashboard
The dashboard refreshes every 30 seconds without a manual page reload. Plausible’s tracking script is also lightweight, so measuring a launch does not mean weighing down the page you are launching.
Filters that work in real time
Select a source, channel, campaign, country, device, page or goal to segment the entire dashboard. You can combine filters to answer focused questions such as “What are visitors from this newsletter viewing right now?” or “Which goals are being completed from this campaign?”
Easy to share
Create a shared link when a teammate or client needs read-only dashboard access without a Plausible account. Shared links can be password-protected and limited to a specific segment.
How to use real-time analytics in Plausible
- Open the dashboard for your site.
- Select Realtime in the date-range picker. You can also press R from the dashboard.
- Watch the current visitor count and the graph for the last 30 minutes.
- Check Top Sources to see where visitors came from and Top Pages to see what they are viewing.
- Review goals and custom events to see what people are doing beyond viewing a page.
- Click any entry to filter the whole dashboard. Add more filters if you want to narrow the audience further.
- Click the X next to a filter when you want to return to the complete live view.
You do not need to enable a separate real-time product or add another tracking script. Once Plausible is installed and receiving traffic, the real-time dashboard is ready to use.
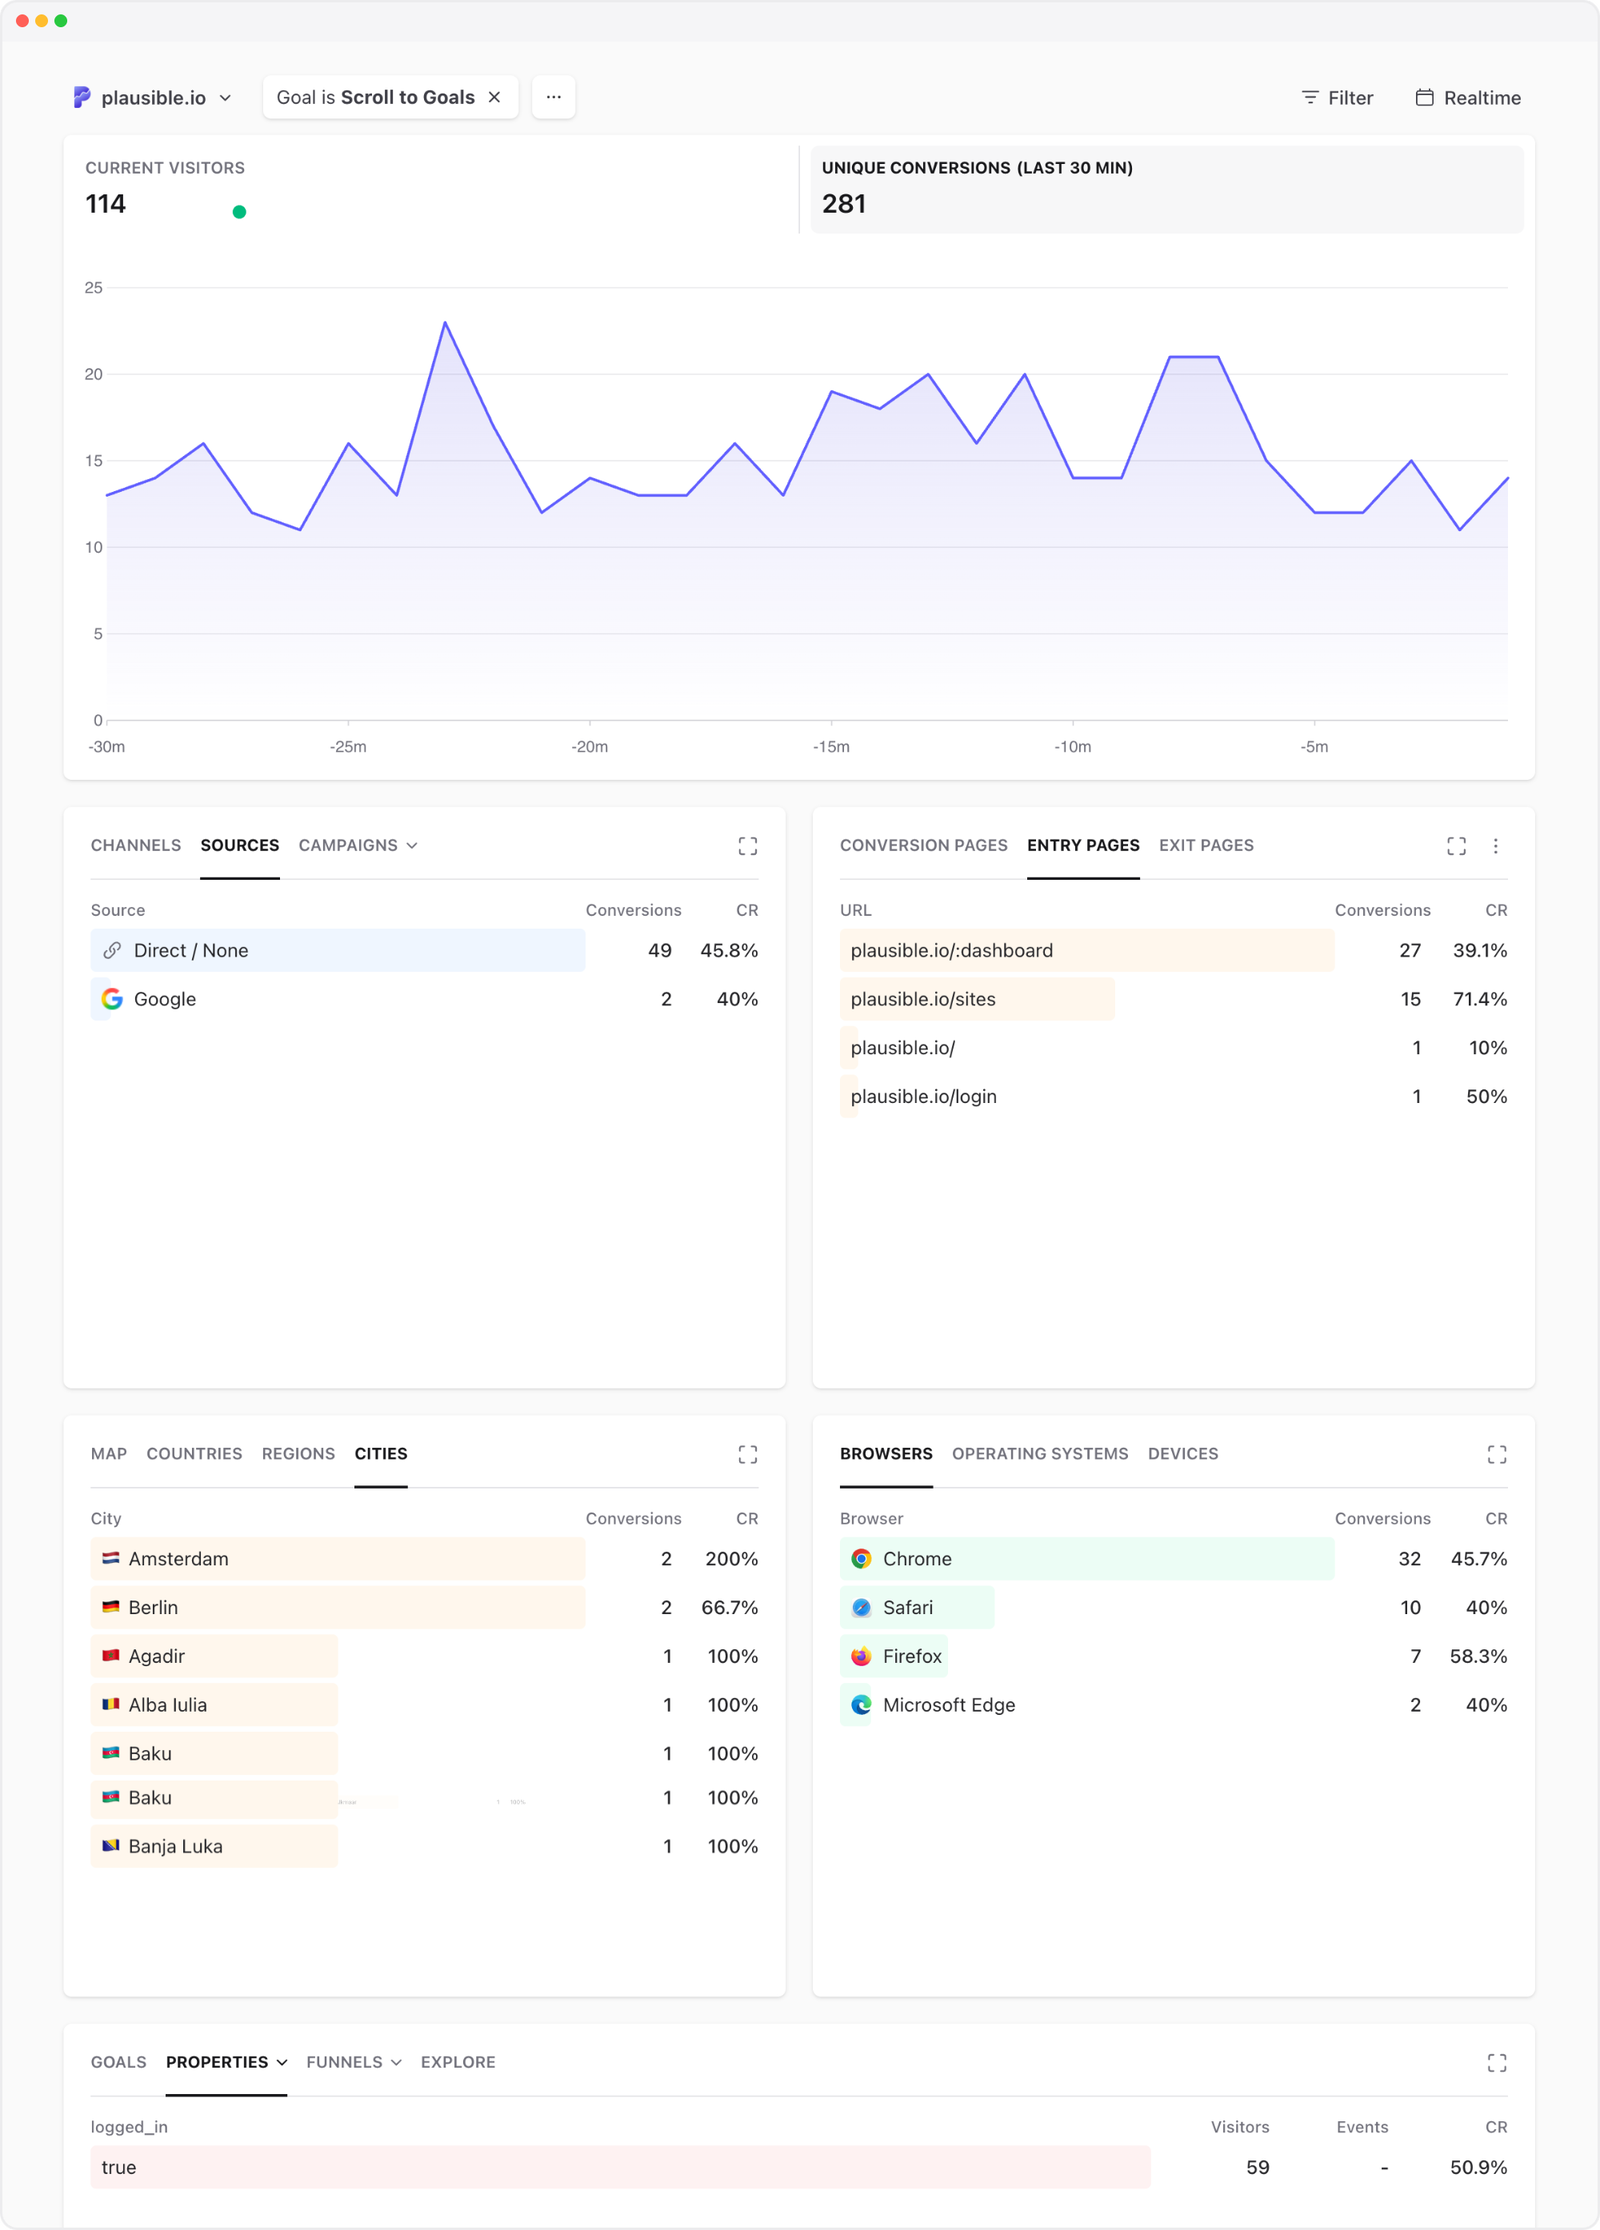
See an example of a real-time dashboard in Plausible, filtered by a goal, showing how it is being completed in real-time:
Plausible vs Google Analytics real-time reports
Both Plausible and Google Analytics 4 show recent website activity. The difference becomes important when you are trying to explain a launch, campaign or sudden spike, not merely confirm that somebody is on the site.
Plausible applies the Realtime period to the same one-page dashboard you already use, so sources, pages, locations, devices and conversions remain together and filterable.
GA4 uses a dedicated, card-based Realtime report. Google also documents limits around processing and attribution within that report.
| Plausible | Google Analytics 4 | |
|---|---|---|
| Layout | The same one-page dashboard, reports and filters used for historical analytics | A dedicated Realtime report arranged across multiple cards |
| Live windows | Current visitors and traffic reports use the last 5 minutes; the graph and conversions cover the last 30 minutes | Active users are shown for the last 5 and 30 minutes |
| Traffic context | Click a source, campaign, page, location, device or goal to filter the complete live dashboard | Apply comparisons to subsets of the Realtime report |
| Attribution | Sources and campaigns remain available as part of the live dashboard | Google says Realtime performs limited attribution analysis and recommends Acquisition reports for the most accurate attribution |
| Processing gaps | The dashboard refreshes every 30 seconds without a manual reload | Google says new or unprocessed users can be excluded from Active users, acquisition data can be incomplete and app events may be delayed by batching |
| Bot filtering | Built-in filtering for known bots, data-center traffic, referrer spam and suspicious patterns | In our controlled test, simulated bot visits appeared in GA4 Realtime while Plausible rejected them |
| Privacy model | No cookies, personal data or individual visitor profiles | Data collection and privacy behavior depend on your GA configuration and consent setup |
GA4’s Realtime report can confirm that activity is reaching your property, but Google’s own documentation warns against treating every card as complete or fully attributed.
Plausible is designed to make live traffic immediately understandable from one place, with bot filtering and privacy-friendly measurement built in. See the full Plausible vs Google Analytics comparison for differences beyond real-time reporting.
Frequently asked questions
What is real-time web analytics?
Real-time web analytics reports website activity within seconds or minutes of it happening. It helps you see current visitors, recent pageviews, traffic sources, popular pages and conversions without waiting for a later report.
What can I see in a real-time analytics dashboard?
In Plausible, you can see current visitors, a graph of activity over the last 30 minutes, top traffic sources, top pages, locations, devices, goals and custom events. You can click any entry to filter the full dashboard and combine filters for a narrower segment.
Does Plausible show real-time visitors?
Yes. Plausible shows the number of Current visitors at the top of the dashboard. This counts visitors who loaded a page in the last five minutes. Click the number, choose Realtime from the date picker or press R to open the complete live view.
Is real-time analytics privacy-friendly?
It can be. “Real time” describes how quickly activity is reported, not how much personal information is collected. Plausible provides aggregate real-time analytics without cookies, personal data or persistent cross-site identifiers, and is fully privacy-friendly.
How is this different from Google Analytics real-time reports?
GA4 presents recent activity in a dedicated Realtime report made up of multiple cards. Plausible applies a real-time time range to the same one-page, filterable dashboard used for the rest of your analytics. See above for a fuller comparison.